Math, Applied
Exploring how math and data shape real-world decisions.
Breaking down complex systems into ideas we can actually use.
Ganita
Hi, I'm Ganita. Describe a decision or data problem in plain language and I'll point you to the best posts here.
Example: “We ran twenty A/B tests and three won. Should we ship them?”
Math foundations
Core probability, distributions, EV, and lines that unlock the business posts.

Probability Basics: Events, Joint Probability, and Independence
Pure probability building blocks before win rates, base rates, and screening.
Read more
Conditional Probability: Given That B Happened
P(A | B) versus P(B | A): restrict the sample space before you read a screen or alert.
Read more
Dependent Chains: Funnel Math Without Bogus Independence
P(step1) × P(step2 | step1) for funnels, pipelines, and onboarding paths.
Read more
Sensitivity, Specificity, and the 2×2 Screening Table
TP, FP, FN, TN and positive predictive value before base rates and thresholds.
Read more
Reading Distributions: Percentiles and Quartiles from Scratch
Sort data, read cutoffs, and understand P90 and quartiles before SLA metrics.
Read more
Expected Value: The Pure Definition
EV as probability-weighted average before campaign and pipeline decisions.
Read more
Linear Models: y = a + bx in Plain Math
Intercept, slope, and residuals before regression forecasting posts.
Read more
Vectors and Features: One Row Is a Point in Space
Spreadsheet rows as feature vectors: dimensions, coordinates, and the design matrix behind ML.
Read more
Dot Product and Cosine Similarity: How Aligned Are Two Vectors?
Dot product vs cosine for search, recommendations, and RAG when vector length varies.
Read more
Matrices and Linear Systems: Regression Is Ax = b
Normal equations and design matrices: the linear system regression actually solves.
Read more
Least Squares: Why Squared Error Picks One Best Line
Sum of squared residuals and why the best-fit line is the unique SSE minimizer.
Read more
Norms and Distance: How Far Apart Are Two Feature Vectors?
L1 and L2 distance for anomaly detection, duplicate search, and comparing rows in feature space.
Read more
Orthogonality: When Two Features Carry Separate Signal
Correlation as angle: orthogonal inputs read cleanly in regression; parallel inputs share credit.
Read more
k-Nearest Neighbors: Classify by the Closest Labeled Examples
Distance-based voting: fraud similarity, routing, and duplicate detection without a training phase.
Read more
Logistic Regression: Linear Boundary, Probability Score
Sigmoid scores, linear decision boundaries, and the bridge from regression to classification.
Read more
Classification Loss: What Optimizers Actually Minimize
Cross-entropy, hinge, and 0-1 loss: why training uses smooth penalties, not accuracy.
Read more
Gradient Descent: How Classifiers Learn Their Weights
Learning rate, gradient steps, and SGD intuition for fitting logistic and neural models.
Read more
Permutations: Order Matters When You Count Arrangements
P(n,r) counting when sequence matters: rankings, seatings, and ordered pipelines.
Read more
Combinations: Choosing a Set When Order Does Not Matter
n choose k for subsets, feature picks, and committees when order does not change the outcome.
Read more
Determinants: Area Scale Factor of a Linear Map
det(A) as signed area scale, singularity when det is zero, and invertibility of linear systems.
Read more
Eigenvalues: Stretch Factors Along Special Directions
λ in Av = λv: stretch factors, characteristic equation, and PCA variance along components.
Read more
Eigenvectors: Directions That Only Stretch, Not Rotate
Directions unchanged in angle under a linear map: principal axes and independent variance.
Read more
Feature Scaling: Why Dollars Crush Session Counts Without Z-Scores
Z-scores and min-max scaling so distance, k-NN, and gradients are not dominated by unit choice.
Read more
Bayes Theorem: Update Belief When New Evidence Arrives
P(A|B) from prior and likelihood: screening, alerts, and flipping evidence into posteriors.
Read more
Confusion Matrix: The Four Boxes Behind Every Classifier Score
TP, FP, FN, TN and how precision, recall, and accuracy are built from the 2x2 table.
Read more
The Normal Distribution: Bell Curves, Mean, and Standard Deviations
Gaussian density, the 68-95-99.7 rule, and when a bell curve is a useful approximation.
Read more
Logarithms and Odds: Why Log-Odds Show Up in Logistic Models
Odds, logit, and log scales that turn multiplication into addition in logistic regression.
Read more
Covariance: How Two Features Move Together
Cov(X,Y), its units, and the bridge to correlation and the covariance matrix.
Read moreSummarize the data
Means, spread, percentiles, and when one number misleads.

Prime Factorization Isn't Just Math: It's How You Break Down Real Problems
Clean batch splits, ETL jobs, and resource planning from number structure.
Read more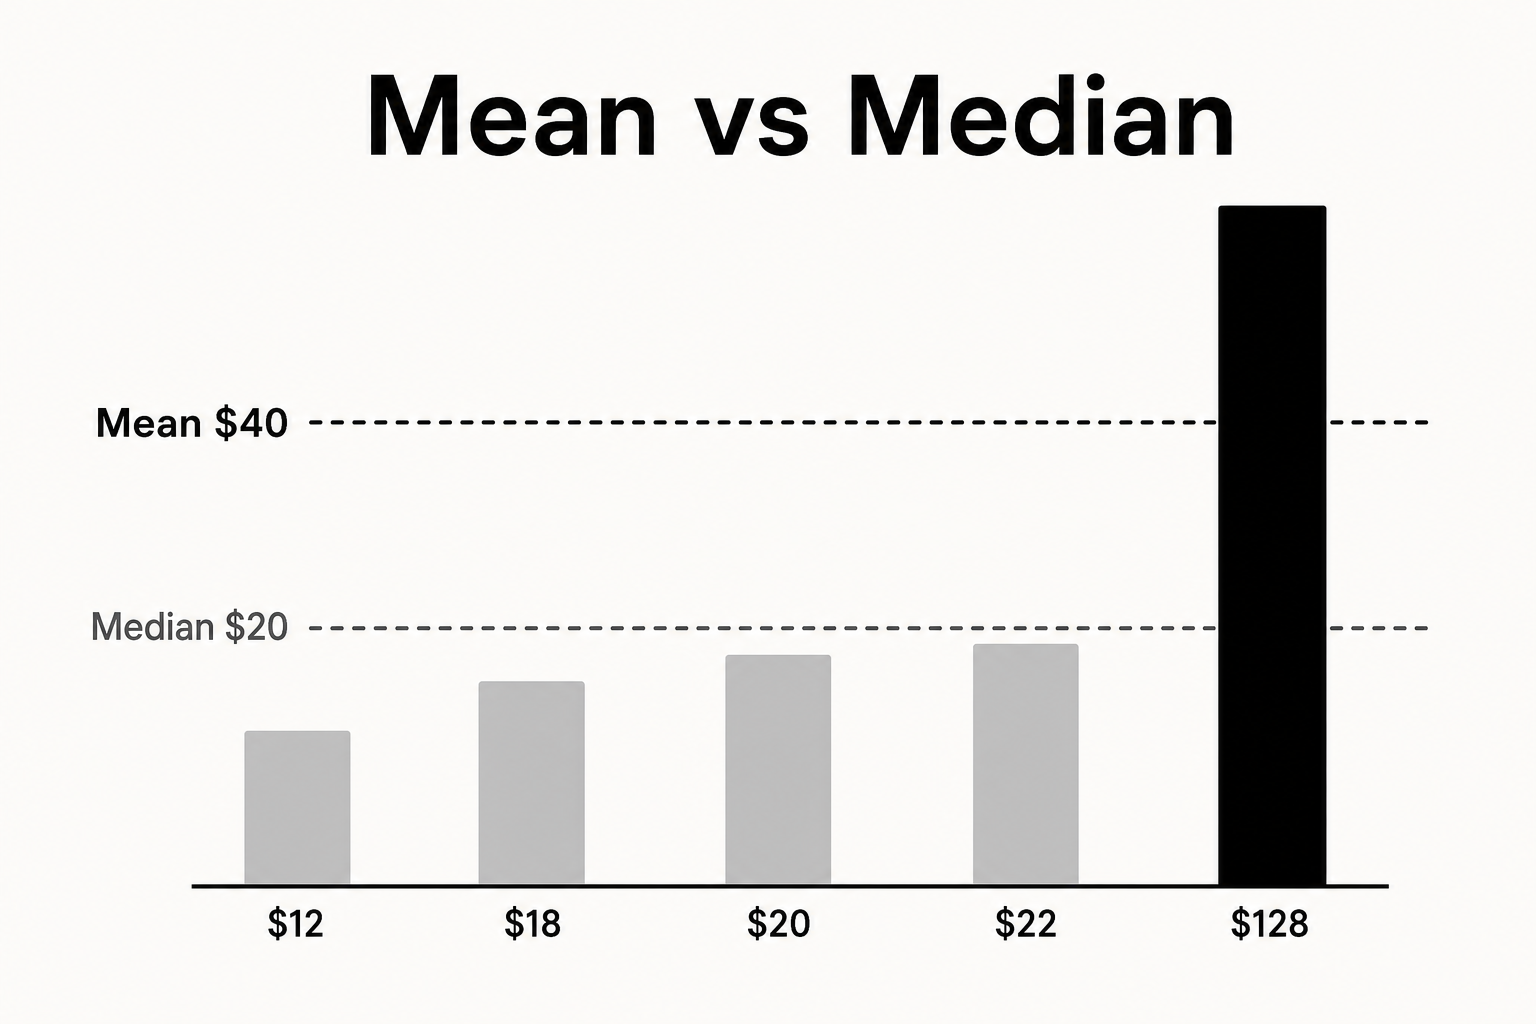
The Average Isn't the Answer: Mean and Median in Real Data
When one summary number misleads dashboards and product decisions.
Read more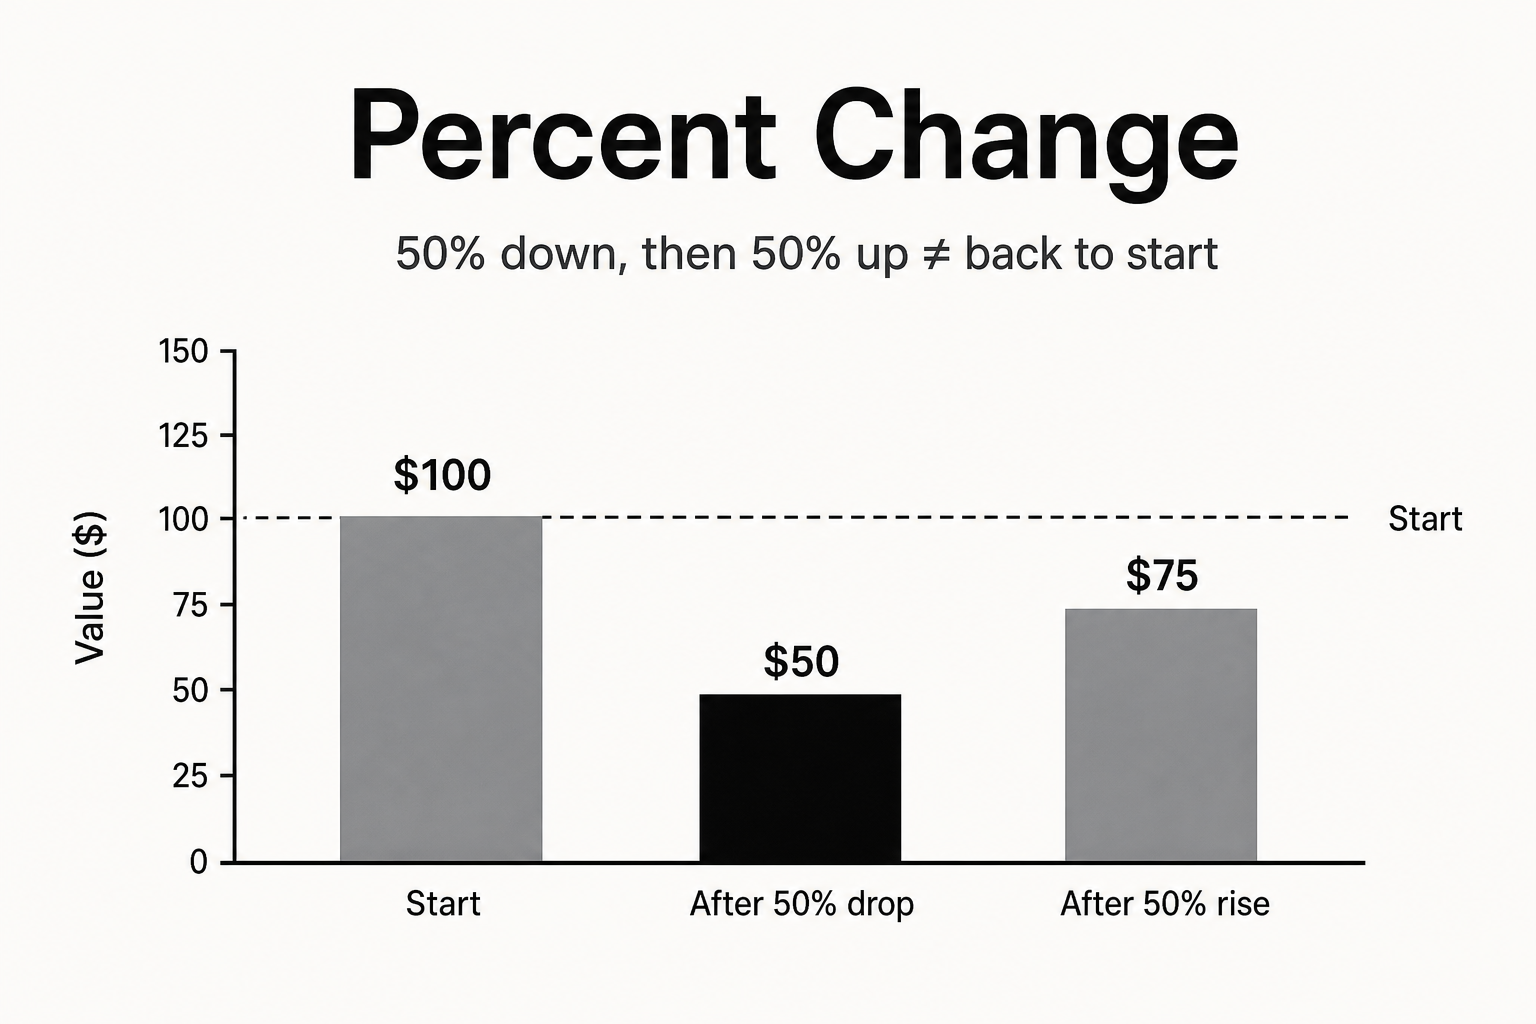
Percent Change Isn't Intuitive: Growth Math in Real Decisions
Why recovery percentages do not undo drops, and how to set targets.
Read more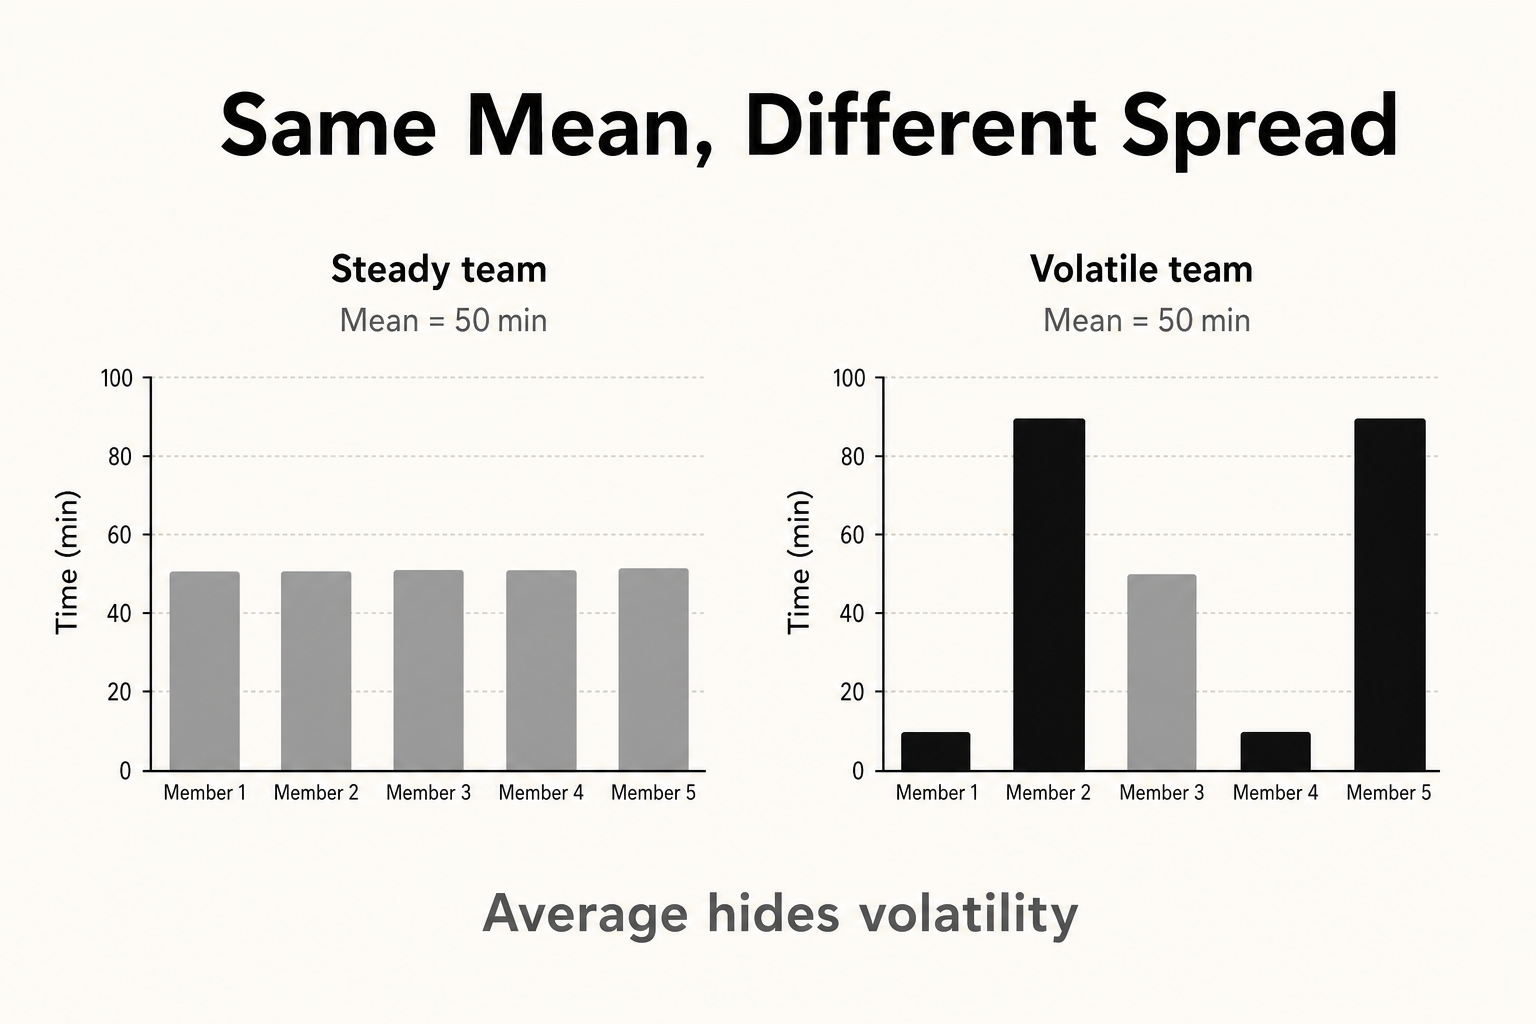
Variance and Spread: Same Average, Different Story
Standard deviation and range for delivery, ops, and reliability.
Read more
PCA Intuition: One Axis for a Wall of Correlated KPIs
Principal components as composite scores when dashboard metrics move together.
Read more
The Average User Isn't Average: Percentiles and Quartiles
P90, SLAs, latency tails, and typical vs worst-case experience.
Read more
Weighted Averages: Roll Up the Number That Matches Volume
Simple vs volume-weighted rollups when segment sizes differ.
Read more
Up 10% Compared to What? Benchmarks and Baselines
Same metric, different story: last month, last year, plan, or peer.
Read more
The New Users Look Great: Cohort Analysis in Real Decisions
Headline retention vs signup cohorts: when the mix shifts and when product quality actually changed.
Read more
More Tickets, Same Workload? Rates vs Counts in Real Data
Total volume vs per-user rate: when headline counts rise because the base grew.
Read more
Up From Last Month: Is That Normal for March? Seasonality
Month-over-month vs same month last year when the calendar drives the metric.
Read moreExperiments and uncertainty
Sample size, probability, intervals, and when to ship.

Bias vs Variance: Underfit, Overfit, and the U-Shaped Error Curve
Expected error as bias squared plus variance: complexity sweet spots before you ship.
Read more
Twelve Data Points Isn't a Trend: Sample Size in Real Decisions
A/B tests, noisy averages, and when a readout is too thin to ship.
Read more
We Ran the Test: Could We Even See a Win? Statistical Power
Detectability before you launch: sample size, baseline, and minimum lift together.
Read more
Probability in Real Decisions: Count Wins, Not Stories
Estimate win rates from trials and know when the read is still shaky.
Read more
At Least One Failure: When Small Risks Compound
P(at least one) = 1 − (1 − p)^n for deploys, SLA misses, and repeated risky trials.
Read more
Stacking Rare Risks: Alert Fatigue From Many Small False Positives
Many low false-positive checks on one case: system alert rate is 1 − (1 − f)^k.
Read more
Will We Run Out? Probability of Stockout in Real Inventory Decisions
Set reorder points using explicit stockout risk instead of gut feel.
Read more
One Number Is Not Enough: Confidence Intervals
Ranges around conversion, CSAT, and defect rates before you ship.
Read more
Base Rates and Updating Beliefs: Rare Events, Loud Alerts
Why a strong alert can still mean mostly false alarms when the base rate is low.
Read more
Classifier Metrics: Precision, Recall, Accuracy, and AUC in Plain Language
TP, FP, FN, TN, every major classifier score, precision vs recall tradeoffs, and draggable ROC/AUC charts.
Read more
Decision Trees: Readable Rules for Classification
Axis-aligned splits, readable if-then policies, and depth tradeoffs for fraud and hiring screens.
Read more
The Model Says 90%: Can You Trust the Score?
Reliability diagrams, overconfident scores, and why accuracy can look fine while auto-block rules fail.
Read more
Where Do You Draw the Line? Threshold Tradeoffs in Real Decisions
Precision vs recall, review capacity, and dollar cost when you pick a classifier cutoff.
Read more
How Many Labels Before You Trust the Metric?
Labeled-set size for precision, recall, and F1 — when the eval band is too wide to ship.
Read more
A/B Test Readouts: Significance Without Jargon
Lift, sample size, interval overlap, and when to ship without p-value talk.
Read more
When Everything Wins Once: Running Many A/B Tests
False winners multiply when you run dozens of null tests in one sprint.
Read more
Simpson's Paradox: When Every Slice Wins but the Total Loses
Segment tables before rollups so mix shifts do not flip the winner.
Read more
False Alarm vs Missed Win: Two Ways an Experiment Decision Goes Wrong
Ship a bad change vs kill a good one: pick which mistake you can afford.
Read more
Expected Value: Compare Bets Without Guessing
Rank campaigns by upside, probability, and cost before spend.
Read moreTraps and causation
Bias, confounders, and conclusions that look right but are not.

Last Quarter's Model, This Quarter's Data: Concept Drift
When live behavior shifts but training accuracy still looks fine — and auto-decisions start misfiring.
Read more
Correlation Isn't Causation: Linked Data in Real Decisions
Confounders, direction, and what you need before acting on r.
Read more
Multicollinearity: When Two Drivers Share the Same Story
Correlated regression inputs make coefficients unstable and driver credit unreliable.
Read more
Ridge Regularization: Shrink Unstable Coefficients Without Dropping Features
Ridge penalty stabilizes collinear regression inputs by shrinking coefficients toward zero.
Read more
The Gambler's Fallacy: Streaks Do Not Load the Next Trial
Five losses in a row does not make the next independent trial more likely to win.
Read more
Your Best Customers Answered: Selection Bias
Surveys, betas, and who never made it into the sample.
Read more
Only the Winners Stay Visible: Survivorship Bias
Success stories hide failures that left the dataset before you measured.
Read more
You Hit the Target and Missed the Point: Goodhart's Law
When the metric becomes the goal, the dashboard greens while the real outcome reddens.
Read more
The Star Performer Slump: Regression to the Mean
Sales quotas, support metrics, and snap-back after extreme scores.
Read more
The Model Looked Perfect on Past Data: Overfitting in Real Decisions
Train vs holdout: when forecasts memorize history instead of predicting new weeks.
Read more
Regression for Prediction: Data to Decisions
Weekly orders from ad spend and email, with forecast, holdout, and scenarios.
Read moreCase studies
Long decision stories with tradeoffs, explorers, and links to the underlying math.
