Math foundations
Covariance: How Two Features Move Together
The idea
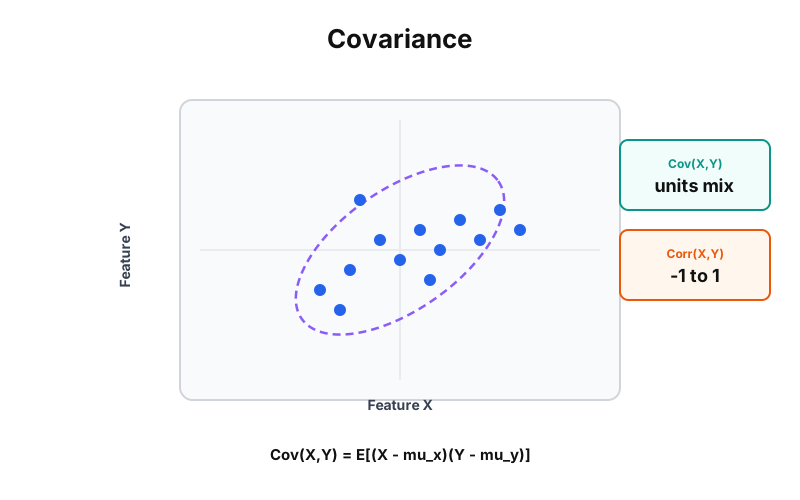
When revenue and order count rise together, their covariance is positive. When support tickets climb while satisfaction falls, covariance turns negative. Covariance captures direction and strength in the units of both features. Correlation rescales by each feature's spread so you can compare relationships across different scales.
Covariance answers: Do these two columns move together, and by how much in raw units?
Example: scatter cloud, covariance, and correlation
Drag correlation strength. Points tilt together or apart. Covariance mixes units; correlation divides by spread so it stays between -1 and 1.
Cov(X, Y)
2.53
Units: (4-scale) x (3-scale). Changes if you rescale a feature.
Corr(X, Y)
0.71
Unitless in [-1, 1]. Cov divided by sigma_X and sigma_Y.
Var(X) diagonal
4.35
Var(Y) diagonal
2.94
moderate positive co-movement: Cov = 2.53 (4 and 3 units mix), Corr = 0.71 (unitless, -1 to 1). Correlation normalizes covariance by spread. Diagonal of the covariance matrix holds variances.
The math
Definition
Average product of centered deviations. Positive when both tend above or below mean together. Zero when no linear co-movement (not necessarily independent).
Correlation
Unitless measure in [-1, 1]. Same sign as covariance. Rescaling X or Y does not change correlation, but it does change covariance.
Covariance matrix
Diagonal entries are variances. Off-diagonal entries match. Symmetric matrix used in PCA, portfolio risk, and multivariate normal models.
A simple application
A correlation heatmap shows revenue vs orders at r = 0.94. That is high shared signal, not a license to claim causation. See correlation vs causation. Near-zero correlation suggests orthogonal inputs. High correlation between predictors triggers multicollinearity warnings in regression.