Math, Applied
The Average Isn't the Answer: What Mean and Median Actually Tell You in Real Data
The idea
When people summarize data, they often reach for one number: the average. In math class, that usually means the mean. You add everything up and divide by how many values you have.
For example, five customer order values:
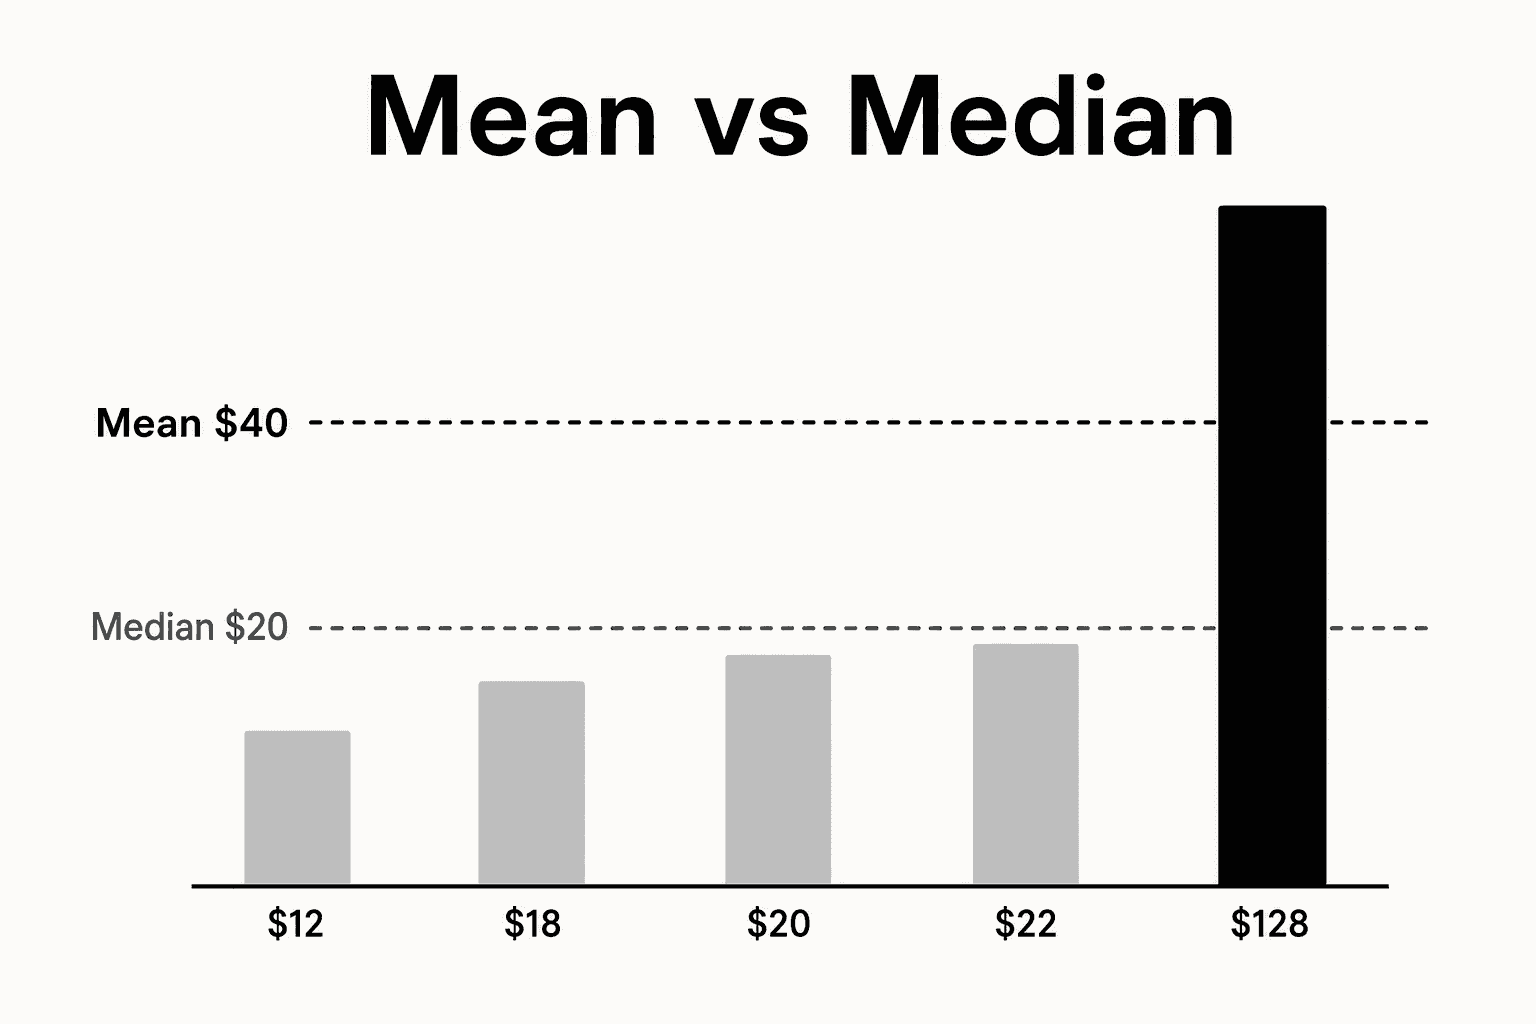
$12, $18, $20, $22, $128
The mean is $40. That is the number most dashboards would show. It is also the number that can mislead you the fastest.
The median is different. You sort the values and pick the one in the middle. For this set, the median is $20. Same data, very different story.
Mean and median are not competing formulas. They answer different questions about the same list of numbers.
Example: customer orders
Toggle the outlier and switch what you highlight. Watch how the mean moves more than the median.
Drag to change the large order ($22–$250).
Mean
$40
Median
$20
Gap
$20
With the outlier at $128, the mean is $40 but the median stays at $20.
The math
Both summaries come from the same list. The difference is how each one treats every value in that list.
Mean (arithmetic average)
Add every order value, then divide by how many orders you have. In the example above, ($12 + $18 + $20 + $22 + $128) ÷ 5 = $40. Every dollar counts equally, including the $128 outlier.
Median
Sort the values: $12, $18, $20, $22, $128. The middle entry is $20. Half the orders are at or below $20, half are at or above. One huge order does not get extra weight just because it is large.
Add one extreme value and the mean moves toward it while the median may barely budge. With more typical orders, the outlier dilutes in the mean but the median shifts only when the middle of the sorted list changes. Shift every value by the same amount and both move together. When mean and median sit far apart, you usually have a skewed tail; that gap is often more informative than either number alone.
Why one summary isn't enough
The mean is pulled toward extreme values. One very large order, one very long wait time, or one unusually high salary can move the average far from what most people actually experience.
The median is more stable in those situations. It reflects the typical case, not the total spread of every value.
This matters because most real decisions are not about totals. They are about what is normal, what is fair, and what most users or customers are likely to see.
If you only report the mean, you can think performance is strong while most of the system is struggling. If you only report the median, you can miss real shifts driven by a small number of high-value events. You need both, plus context.
A simple application: customer spend
Imagine you are reviewing monthly spend for a product with mostly small purchases and a few large ones.
Customer spend: mean vs median in a review
Move the outlier order size. Watch the mean chase one big customer while the median stays closer to typical spend.
Mean $40 vs median $21 — gap $19
Order sizes
Center metrics
Median: $21 · Mean: $40
Mean spend
$40
Median spend
$21
Gap
$19
Mean − median
Optimize (move here)
- • Report median for typical customer decisions
- • Use mean when budgeting total revenue
Hold (do not over-react)
- • Scaling a feature because mean moved when median did not
Escalate if
- • Median and mean diverge for two consecutive reviews
Leadership sees mean growth. Most customers did not change. Use median for typical spend; mean for revenue totals.
The mean spend might rise because a handful of customers upgraded or bought premium plans. Leadership sees growth. Marketing calls it a win.
The median spend might barely move. That tells you most customers are behaving the same way they did before. Growth is concentrated, not broad.
Mean answers: What is the total per customer on average?
Median answers: What does a typical customer look like?
Those are different business questions. Using the wrong one leads to the wrong decision, such as scaling a feature that only helps your top spenders while assuming everyone benefits.
The same pattern shows up in response times, delivery delays, and survey scores. One outlier can inflate the mean. The median keeps you grounded in everyday experience.
Choosing between mean and median is not a technical detail. It is a decision about what you are trying to understand.
Use the mean when totals matter and outliers are part of the real story you care about, such as revenue, inventory, or capacity planning.
Use the median when you care about typical behavior and want a number that is not easily distorted by a few extreme values.
In practice, the strongest analysis includes both. The gap between them is often more informative than either number alone. A rising mean with a flat median usually means change is concentrated. A flat mean with a falling median can mean trouble is spreading through the typical case even before totals move.
Most misleading conclusions in data do not come from bad math. They come from summarizing too much into one number and picking the wrong one.
Mean and median are simple tools, but they shape how teams interpret results, set targets, and decide what to fix. When you report both and explain the gap between them, you move from a vague average to a clearer picture of what is actually happening.