Math, Applied
Variance and Spread: Why the Same Average Can Hide a Very Different Story
The idea
The mean tells you the center of a dataset. It does not tell you how spread out the values are. Two groups can share the same average while behaving very differently.
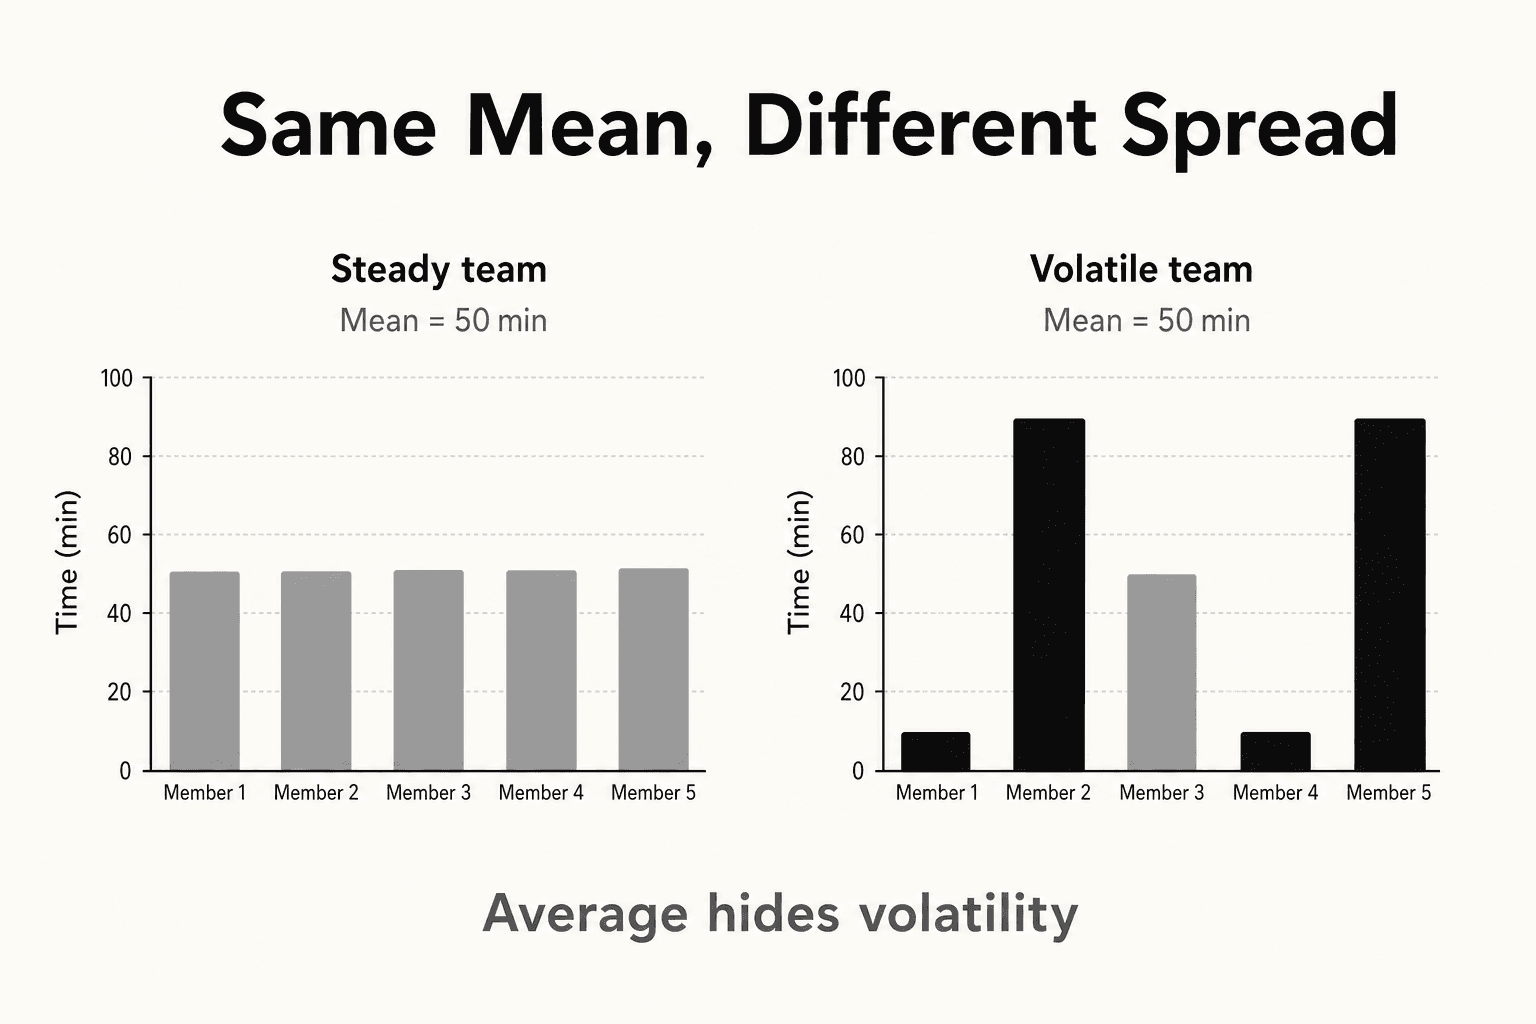
For example, average delivery time is 50 minutes for both teams:
Team A: 47, 49, 50, 51, 53 minutes
Team B: 22, 38, 50, 62, 78 minutes
Same mean. Very different experience. Team A is predictable. Team B swings between very fast and very slow days.
Variance and spread measure that difference. They describe how far values typically sit from the average, which is often what people feel in practice.
Example: same average, different spread
Two delivery teams can share the same mean time while feeling very different to customers. Increase spread to see variance rise even when the mean stays similar.
Widen or tighten how far values sit from the mean.
Mean
50 min
Std. deviation
2 min
Range
6 min
Mean is 50 min. Standard deviation is 2 min, so typical days often land within about 2 min of the average. Range is 6 min from fastest to slowest — a simple view of total spread.
The math
Spread measures how far values sit from the center. Two teams can share the same mean while having very different variance.
Variance (average squared distance from the mean)
For each delivery time, subtract the mean, square the gap, then average those squares. Squaring prevents positive and negative gaps from canceling out. Team A's tight cluster produces a small variance. Team B's wide swings produce a large one.
Standard deviation
Take the square root of variance so the result is back in the original units (minutes, dollars, etc.). Team A might have σ ≈ 2 minutes. Team B might have σ ≈ 20 minutes. Same mean, very different reliability.
Range (quick read)
The full gap from smallest to largest value. Easy to compute, but one outlier can stretch the range without describing the middle of the data.
Push values farther from the mean and variance grows; the mean can stay put if increases and decreases balance. One outlier hits variance hard because squaring amplifies large gaps. Shift every value by the same amount and the mean moves, but spread stays the same because spread describes shape, not location. On a slide, standard deviation is usually clearer than variance because it stays in the original units, like minutes or dollars.
Why the average is not enough
When values cluster tightly around the mean, outcomes feel stable. When they are widely scattered, the same mean can still feel risky or inconsistent.
Standard deviation is a practical way to express spread. It has the same units as the original data, such as minutes or dollars, which makes it easier to interpret than variance alone.
A low standard deviation means most values are close to the mean. A high standard deviation means wider swings. Range — the gap between the smallest and largest value — gives a quick sense of total spread, though it ignores everything in between.
This matters because many decisions depend on consistency, not just central tendency. Reliability, customer trust, and operational planning all care about spread.
A simple application: delivery performance
Suppose leadership compares two teams with the same average delivery time of 50 minutes. On paper, they look equal.
Delivery performance: same mean, different spread
Adjust volatility on Team B. Both teams can share an average while reliability diverges.
Both average 50 min — Team B std dev 19.8 vs Team A 2.0
Team A (predictable)
Team B (volatile)
Both means
50 min
Team A std dev
2.0 min
Team B std dev
19.8 min
Optimize (move here)
- • Track std dev or p90 beside mean in ops reviews
- • Reward consistency when customers feel variance
Hold (do not over-react)
- • Calling teams equal because averages match
Escalate if
- • Team B p90 worsens while mean stays flat
Same headline average hides operational pain on Team B. Staff and promise SLAs using spread, not mean alone.
Team A usually lands between 47 and 53 minutes. Planning is easier. Customers get a predictable experience.
Team B often delivers in the 20s on some days and the 70s on others. The mean is still 50, but the process is harder to trust and harder to staff for.
Mean answers: What is the typical center?
Spread answers: How much does performance swing around that center?
If you only track the mean, you might reward the volatile team and miss the operational cost of inconsistency. If you track spread alongside the mean, you see which team is actually more reliable.
Variance is not just a classroom formula. It is a way to quantify uncertainty in real systems.
In data work, spread shows up in experiment results, model error, forecast confidence, and quality control. Two options with the same average outcome can carry very different risk profiles once you look at variation.
The strongest summaries usually include center and spread together: mean or median, plus standard deviation or a clear range. That combination tells you both where things tend to land and how much they move around that point.
Averages are useful, but they are incomplete. They compress a full distribution into one number and can hide volatility that people experience every day.
When you add spread to the story, you stop comparing teams, products, or time periods on center alone. You start asking the more useful question: not just what is typical, but how stable is typical?