Math foundations
Confusion Matrix: The Four Boxes Behind Every Classifier Score
The idea
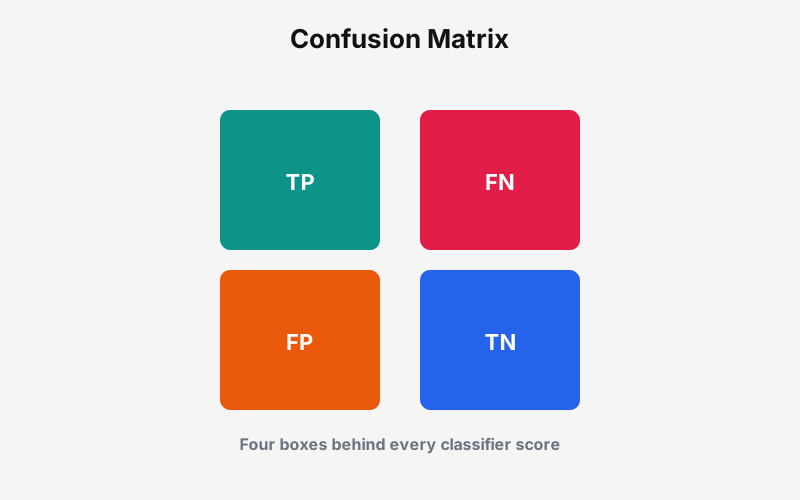
Every classifier prediction lands in one of four boxes. True positives and true negatives are correct calls. False positives waste reviewer time or block good customers. False negatives are the silent misses you may never see in the alert queue.
Precision, recall, and accuracy are just arithmetic on these four counts. Change the threshold and the boxes shift. That is why one accuracy number rarely tells the full story when classes are imbalanced.
Start with the matrix: every score you report should trace back to TP, FP, FN, and TN.
Example: the 2x2 confusion matrix
Every classifier score traces back to four counts. Adjust prevalence, sensitivity, and specificity to see precision, recall, and accuracy update live.
Four boxes explain every classifier score. Counts drive precision, recall, and accuracy.
Confusion matrix (n = 10,000)
Precision
18.7%
Recall
90.0%
Accuracy
92.0%
Precision 18.7%: of 964 flagged rows, 180 are true fraud. Recall 90.0% catches most positives; accuracy 92.0% mixes both classes.
The math
True positive
Correct alarm. The model flagged a row that truly belongs to the positive class.
False positive
False alarm. A negative row flagged as positive. Drives reviewer load and customer friction.
False negative
Missed case. A positive row scored below threshold. Often the costliest error in fraud or safety.
True negative
Correct clearance. Negative row left alone.
Precision
Of all positive predictions, how many were right? Answers what a flag means in the queue.
Recall
Of all actual positives, how many did you catch? Same as sensitivity on the positive class.
Accuracy
Share of all rows classified correctly. Can look high when negatives dominate the population.
A simple application
In a model review, print the confusion matrix at the chosen threshold before debating AUC. Ask which box hurts most for your product: false alarms in the queue or missed fraud in the tail.
The classifier-metrics and sensitivity-specificity posts build on these four counts. Master the matrix first and the derived scores become bookkeeping.