Experiments and uncertainty
Bias vs Variance: Underfit, Overfit, and the U-Shaped Error Curve
The idea
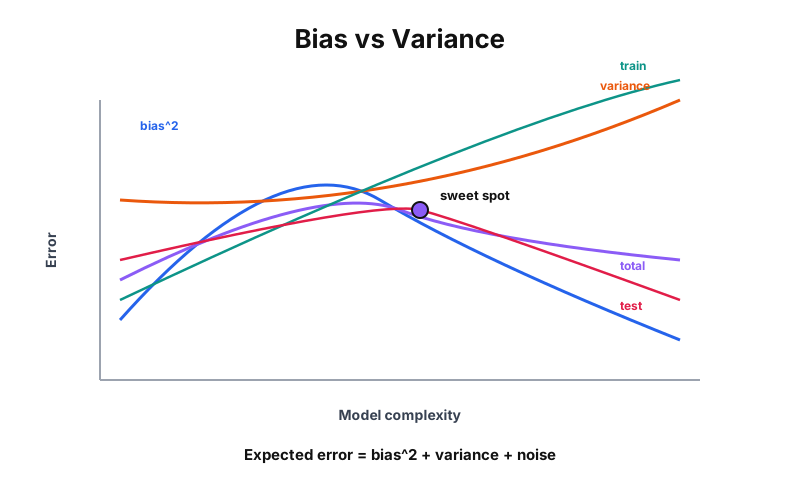
Every model sits on a dial from too simple to too flexible. A straight line on messy weekly orders underfits: high bias, missed patterns. A wiggly curve through every spike overfits: low bias on training weeks, high variance on new ones. Expected error is the sum of both plus irreducible noise.
Bias vs variance answers: Is the model too dumb, too memorized, or near the sweet spot?
Example: bias^2, variance, and the U-shaped test error
Drag model complexity. Bias falls and variance rises. Total expected error is their sum plus noise. Train error keeps dropping while test error bottoms out, then climbs.
Decomposition vs complexity
Train vs test error
bias^2
8.7%
variance
5.7%
total
19.4%
train
22.1%
test
12.0%
Near the sweet spot (complexity ~4/10): total error 19.4% balances bias^2 8.7% and variance 5.7%. Test error 12.0% is near its minimum.
The math
Expected error decomposition
Bias² is systematic miss from an overly rigid model. Variance is swing from fitting random quirks. Noise is what no model removes. Total error is U-shaped in complexity.
Too simple
Train and test error stay high together. Adding features or capacity usually helps until you pass the sweet spot.
Too flexible
Train error keeps falling while test error rises. The gap is the overfitting signal you see in holdout weeks.
A simple application
A demand forecast with complexity 9 scores 4% on training weeks and 22% on holdout weeks. Complexity 4 lands at 9% holdout with only slightly higher train error. That is the bias variance tradeoff in one meeting slide. For train vs holdout mechanics and shipping decisions, see overfitting in real decisions.