Math foundations
The Poisson Distribution: Rare Events Over a Fixed Window
The idea
Support tickets per hour, checkout errors per day, cars through an intersection per minute. You do not have a fixed number of trials — just an average rate. The Poisson distribution gives the probability of seeing exactly k events in one window when events arrive independently at that steady rate λ.
Poisson answers: given an average of λ events per window, how likely is each exact count?
Example: event counts in a fixed window
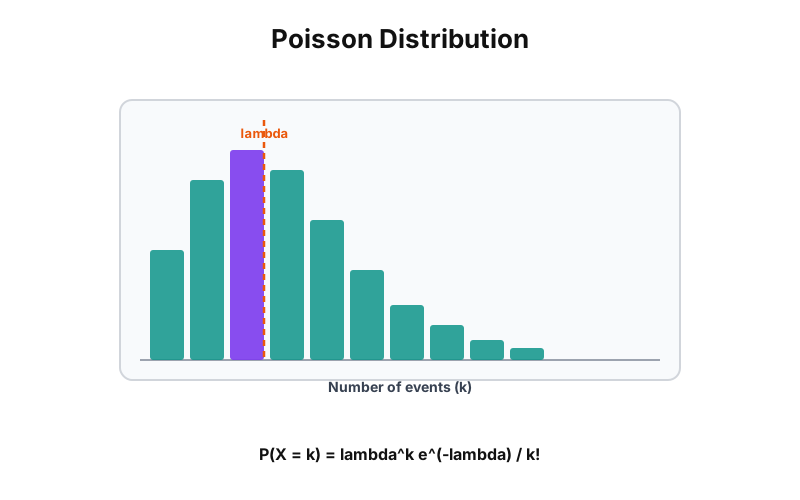
Slide the average rate lambda (support tickets per hour, arrivals per minute). Each bar is the probability of exactly that many events in one window. Mean and variance are both lambda.
Mean = lambda
3.0
Std dev
1.73
P(zero events)
5.0%
With an average rate of 3.0 events per window, the count varies by about 1.7 (variance equals the mean). Roughly 5.0% of windows see zero events. As lambda grows the shape drifts toward a bell curve.
The math
Probability mass function
λ is the mean count per window. Larger λ shifts the peak right and widens the spread. The e^(-λ) term is the probability of zero events; each extra event multiplies by λ/k.
Mean equals variance
A signature property: the mean and variance are identical. If your real-world counts are far more spread out than their average, the data is over-dispersed and Poisson is the wrong model.
A simple application
Poisson is the limit of the binomial when trials are many and each success is rare (n → ∞, p → 0, np = λ). It powers capacity planning, alert-rate baselines, and staffing: if tickets average 3 per hour, Poisson tells you how often you will see 7+ and need overflow coverage. As λ grows it approaches the normal distribution.