Math foundations
Maximum Likelihood: Pick the Parameter That Best Explains the Data
The idea
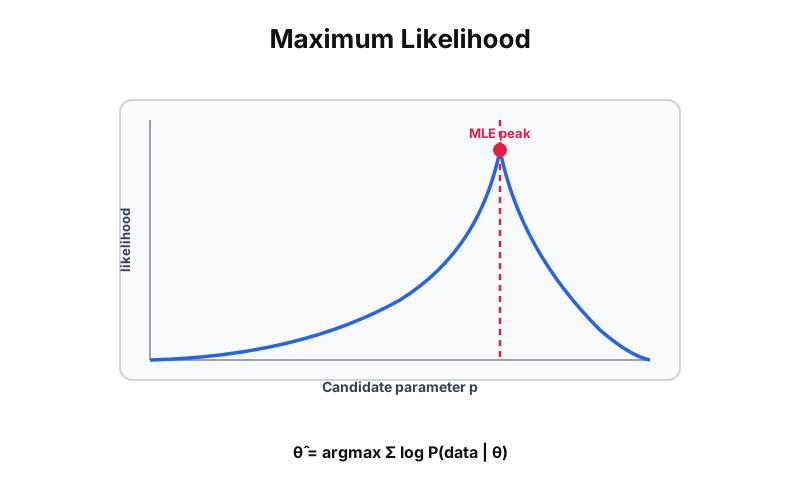
You saw 7 heads in 10 flips. What is the coin's bias? Maximum likelihood turns the question around: instead of asking how likely the data is under one fixed p, it sweeps every possible p and picks the one that makes what you actually observed most probable. For the coin, that answer is simply 7/10 — but the same principle fits regressions, classifiers, and distributions.
MLE answers: of all the parameter values I could pick, which one makes the data I saw the least surprising?
Example: which coin bias best explains the flips?
Fix how many heads you saw out of how many flips. The curve is the likelihood of each possible bias p. Drag your guess and watch it climb toward the peak — the maximum-likelihood estimate.
MLE = heads / flips
70%
Your guess's likelihood
44% of peak
7 heads in 10 flips. The maximum-likelihood estimate is simply heads / trials = 70%. Your guess is 0.82 log-likelihood units below the peak, so 70% explains these flips better.
The math
Likelihood
The likelihood is the probability of the whole dataset as a function of the parameter θ. For independent observations it is the product of each point's probability.
Log-likelihood
Maximizing the log turns the product into a sum, which is easier to optimize and numerically stable. The maximizer θ̂ is the maximum-likelihood estimate.
A simple application
Maximizing likelihood is the same as minimizing a loss function: negative log-likelihood for a Bernoulli model is cross-entropy, which is why logistic regression is fit this way. In practice you climb to the peak with gradient descent, and the log-odds show up because of logarithms and odds.